Understanding the Shape of the U.S. Treasury Yield Curve
Commentary
The U.S. Treasury Yield Curve is a chart that illustrates the yields on U.S. Treasury securities over different maturity periods. It demonstrates the relationship between the yield and the length of time until the Treasury’s fixed-income securities mature.
The yield curve includes a range of fixed-income securities issued by the U.S. Government, such as Treasury Bills (T-Bills), Treasury Notes (T-Notes), and Treasury Bonds (T-Bonds). These are considered low-risk investments because they are guaranteed by the U.S. Government’s “full faith and credit.” Treasury bills are short-term securities with maturities of up to one year, while Treasury bonds and notes are longer-term, with bonds maturing in 10 to 30 years and notes between 2 and 10 years. This curve is crucial in understanding bond markets, interest rates, investor expectations and the overall health of the US economy.
Components of the Yield Curve
The Yield Curve graph is made up of an X-axis and a Y-axis. The X-axis (horizontal) displays the maturity of the debt securities, starting on the left with short-term Treasury bills that mature anywhere from a few days to one year. It then progresses to Treasury notes with maturities of two to ten years, and concludes on the right with bonds that have longer maturities of 20 and 30 years.
The Y-axis (vertical) depicts the yield or interest rates associated with each maturity. It indicates the potential return investors can expect from these securities if they hold them until they mature.
Curve Shape
Understanding the shape of the yield curve is crucial for businesses, investors, and policymakers as it provides valuable insights into the economic outlook and helps guide decision-making. There are three main types of yield curve shapes: normal, flat, and inverted.
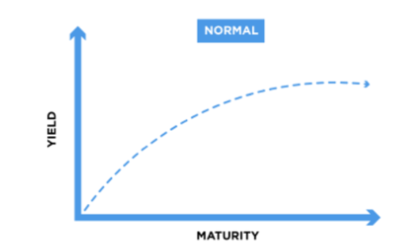
A normal yield curve is characterized by an upward slope, where long-term debt instruments yield more than their short-term counterparts. This is the most common shape for a yield curve, beginning with lower yields on the left (short-term yields) and rising towards higher yields on the right (long-term yields). The curve ascends as investors require higher returns for longer maturities to compensate for the increased risks associated with longer-term investments, such as default risk and potential fluctuations in interest rates.
In contrast, an inverted yield curve is relatively uncommon and occurs when the interest rates on long-term bonds are lower than those on short-term bonds, causing the yield curve to slope downward instead of upward. Typically, long-term bonds carry higher interest rates than short-term bonds because of the greater risks associated with longer maturities.
There are various perspectives on an inverted yield curve. One common belief is that it could indicate an upcoming economic downturn. Consequently, investors may flock to the safety of longer-term bonds for security, driving up their prices and lowering their yields.
An inverted yield curve may also signal that the Fed may reconsider its policy of raising interest rates. Anticipating a future economic slowdown, investors may expect the Fed to decrease short-term interest rates to stimulate the economy and ward off a recession.

As the name suggests, a flat yield curve is defined by yields that are comparable for both short- and long-term maturities. Bonds with shorter maturities and those with longer maturities exhibit similar yields on the curve. When a flat yield curve emerges, it often signals uncertainty in the market, making investors cautious about making investments or committing to long-term positions.

What determines the slope of the yield curve?
The slope of a yield curve is influenced by various factors that reflect market expectations, economic conditions, and investor sentiments. Several key factors influence the slope of the yield curve, ranging from central bank policy to market expectations about inflation and economic growth.
Central banks influence the yield curve through their monetary policy decisions. By adjusting key interest rates like the federal funds rate—which serves as a benchmark for other rates in the economy and determines the rate at which banks lend to one another overnight—the Federal Reserve can affect short-term interest rates, thus influencing the short end of the yield curve.
Expectations about future inflation also significantly shape the yield curve. A steeper curve may emerge if investors demand higher yields on long-term bonds, anticipating higher inflation that could erode purchasing power over time. Conversely, if inflation expectations decrease, the yield curve may flatten or even invert.
The yield curve can be impacted by market sentiment and investor perceptions of risk. Investors may gravitate toward longer-term Treasuries in times of uncertainty or increased risk aversion, which would drive down their yields and possibly flatten or invert the yield curve. Conversely, in times of strong economic growth, investors might favour assets with higher risk and higher return that may result in higher long-term rates and a steeper curve.
Present U.S Current Yield Curve
The U.S. Treasury Yield curve is currently inverted, which means that short-term interest rates are higher than long-term rates. This situation arose from a significant shift in the Federal Reserve’s (Fed) monetary policy starting in 2022. In response to the initial sharp increase in inflation during 2021 and 2022, the Fed raised the federal funds target rate to maintain price stability. This rate escalated from nearly 0% at the beginning of 2022 to a range of 5.25% to 5.50% by July 2023. As a result, yields on publicly traded bonds increased across the board, with the most substantial rises seen in short-term instruments.
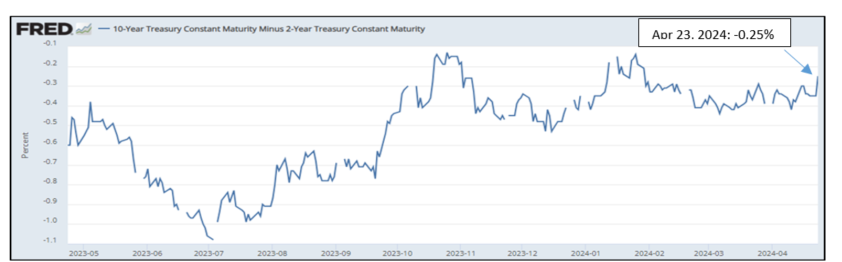
Since it has been a fairly reliable leading indicator of a recession in recent decades, many investors have used the difference between the yields on 10-year and two-year U.S. Treasury bonds as a proxy for the yield curve. Shorter-term maturities are thought to provide more information about the probability of a recession, according to some Federal Reserve officials. A spread that approaches 0, signifies a flattening yield curve whereas, a negative spread has historically been viewed as a precursor to a recessionary period. As of April 23rd 2024, the 10-2-year Treasury Yield spread is at -0.25% compared to -0.60% last year. Despite this prolonged inversion, the shape of the curve has evolved, becoming flatter than it was in 2023.
What to expect
Presently, monetary policy is the primary driver of the U.S. Treasury Yield curve. In March 2024, US inflation continued its upward trend for a second consecutive month, reaching 3.5% year-over-year, up from 3.2% in February, driven by rising energy costs. According to Fed Chair Jerome Powell, this persistently high inflation is likely to postpone any interest rate cuts by the Federal Reserve until later this year, suggesting that interest rates might remain elevated for an extended period.
Should the Fed decide to delay rate cuts due to ongoing high inflation, there is the possibility that the U.S. Treasury yield curve flatten, as long-term yields could increase faster than short-term rates. With expectations that inflation will stay high, investors will likely demand higher yields on long-term investments to offset the risks of inflation, pushing these rates up.
Conversely, the decision to delay rate cuts might indicate the Fed’s confidence in the economy’s strength and its ability to withstand higher interest rates without slipping into recession. As a result, short-term rates might not rise as sharply.
The US economy is currently demonstrating robust growth, with a 3.1% expansion in Q4 2023—the strongest in nearly two years, up from 2.9% in the previous quarter. Economic activity is expected to remain strong, supported by vigorous consumer spending and a solid labour market. At their March 2024 meeting, the Federal Reserve revised its forecast for Core Personal Consumption Expenditure (PCE)—its preferred inflation metric—raising it to 2.6% for 2024 from the previous estimate of 2.4% in December 2023. They also adjusted their GDP growth projection to 2.1%, up from 1.4%.
Given the likelihood of sustained inflationary pressures, the current scenario suggests that interest rates may stay higher for a longer period. However, any changes in economic indicators or Federal Reserve policy could alter this trajectory. Investors should remain alert and ready to quickly adjust their portfolios in response to new economic data or policy shifts.
DISCLAIMER
First Citizens Bank Limited (hereinafter “the Bank”) has prepared this report which is provided for informational purposes only and without any obligation, whether contractual or otherwise. The content of the report is subject to change without any prior notice. All opinions and estimates in the report constitute the author’s own judgment as at the date of the report. All information contained in the report that has been obtained or arrived at from sources which the Bank believes to be reliable in good faith but the Bank disclaims any warranty, express or implied, as to the accuracy, timeliness, completeness of the information given or the assessments made in the report and opinions expressed in the report may change without notice. The Bank disclaims any and all warranties, express or implied, including without limitation warranties of satisfactory quality and fitness for a particular purpose with respect to the information contained in the report. This report does not constitute nor is it intended as a solicitation, an offer, a recommendation to buy, hold, or sell any securities, products, service, investment or a recommendation to participate in any particular trading scheme discussed herein. The securities discussed in this report may not be suitable to all investors, therefore Investors wishing to purchase any of the securities mentioned should consult an investment adviser. The information in this report is not intended, in part or in whole, as financial advice. The information in this report shall not be used as part of any prospectus, offering memorandum or other disclosure ascribable to any issuer of securities. The use of the information in this report for the purpose of or with the effect of incorporating any such information into any disclosure intended for any investor or potential investor is not authorized.
DISCLOSURE
We, First Citizens Bank Limited hereby state that (1) the views expressed in this Research report reflect our personal view about any or all of the subject securities or issuers referred to in this Research report, (2) we are a beneficial owner of securities of the issuer (3) no part of our compensation was, is or will be directly or indirectly related to the specific recommendations or views expressed in this Research report (4) we have acted as underwriter in the distribution of securities referred to in this Research report in the three years immediately preceding and (5) we do have a direct or indirect financial or other interest in the subject securities or issuers referred to in this Research report.
