‘Disinversion’ of the United States Yield Curve
Commentary

The yield curve is an economic indicator in the form of a graphical representation that illustrates the relationship between interest rates (yields) of bonds with different maturities but similar credit quality, typically government bonds. This graphical representation, with yields plotted on the vertical axis and the time to maturity on the horizontal axis reveal how interest rates shift across various time horizons. Globally, the most commonly analysed yield curve is that of U.S. Treasury bonds, which serve as a benchmark in global markets, as a proxy for “risk free” returns as they are backed by the full faith and credit of the United States Government.
Yields on U.S. Treasuries are of central importance in shaping interest rates for a wide range of debt instruments including corporate bonds, mortgages, and other consumer loans. Since U.S. Treasuries are seen as a safe haven, other bonds or loans, which carry inherently higher risk premiums, offer higher interest rates to attract investors. This additional interest cost that compensates investors for the increased risk, when compared to U.S Treasury Bonds is referred to a “risk premium.”
Forward Looking Indicator: The Shape of the Yield Curve
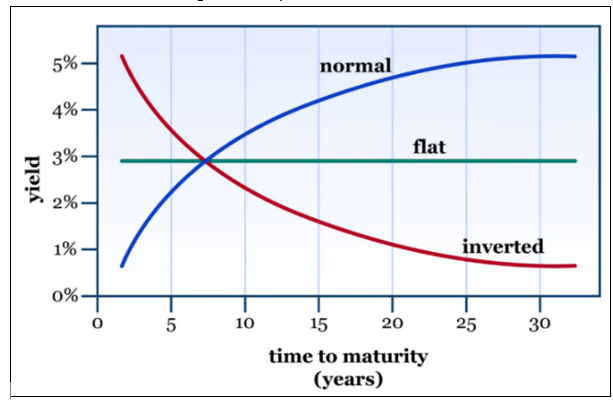
The yield curve’s shape provides insight into the future of interest rates, and also signal investors’ expectations for future economic growth and inflation. The yield curve can have three (3) shapes- Upward sloping, inverted or downward sloping and flat.
Figure 1: Shapes of the Yield Curve

A yield curve typically slopes upward because longer-term investments generally offer higher yields, reflecting the increased risk and uncertainty associated with them. Investors demand higher returns as compensation for potential fluctuations in interest rates, inflation, and economic conditions over time. Lending money for extended periods involves greater exposure to these uncertainties, which can affect the value of the investment. To offset this uncertainty, investors demand a higher return, or yield, on bonds with longer maturities. This results in long-term bonds generally offering higher yields than short-term bonds, creating an upward-sloping curve under normal conditions.
At times, the yield curve can be inverted, and this occurs when short-term interest rates are higher than long-term rates. This unusual situation can signal that investors expect economic trouble ahead, such as a recession. In such cases, they may seek the safety of long-term bonds, driving down their yields. As a result, the yield curve slopes downward instead of upward. An inverted yield curve is significant for investors because it may signal a slowdown in economic growth or a recession, prompting caution and careful investment decisions.
Yield curves can also be flat, when there is little difference between the interest rates on short-term and long-term bonds. This happens when investors are uncertain about the future of the economy. In such times, they may expect slower growth or lower inflation, as such there is lower demand for higher yields of longer-term investments. A flat yield curve can signal that the economy is at a turning point, where it could either slow down or pick up. For investors, a flat curve suggests caution, as it reflects uncertainty about future interest rates and economic conditions.
The Yield Curve Becomes Inverted
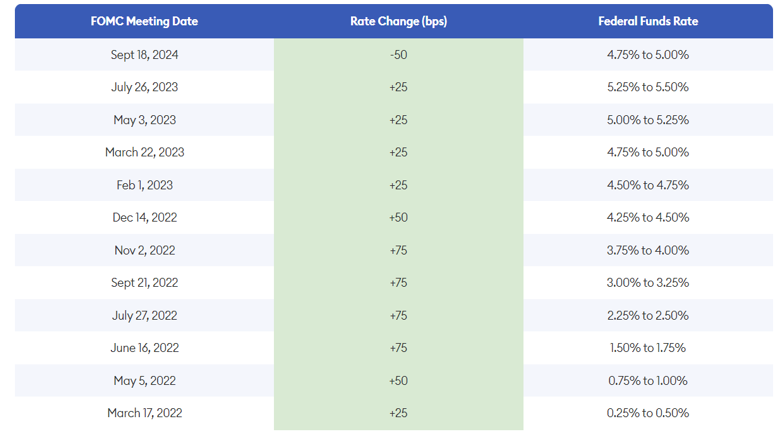
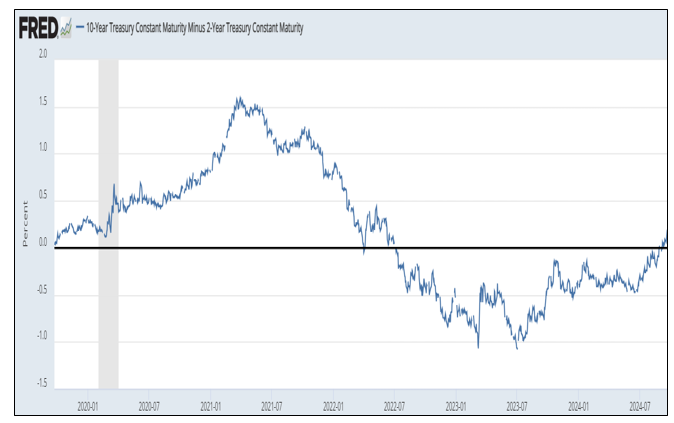
In 2022, the Federal Reserve launched an aggressive series of rate hikes, raising interest rates by 225 basis points (bps) between March and July to combat rising inflation. This caused short-term yields to climb faster than long-term yields since short-term rates are more closely tied to the Fed’s actions. By July 2022, the yield curve inverted, with 2-year Treasury yields surpassing 10-year Treasury yields. Despite these increases, inflation remained high, prompting even more aggressive rate hikes that continued into 2023. Over this period, from March 2022 to July 2023, the Fed raised rates by a total of 525 bps, resulting in an extended yield curve inversion.
Figure 2: Fed Rate Hikes 2022-2024

This yield curve inversion has lasted longer than ever before, extending over two years. However, the recession that many expected has been notably delayed. In the first quarter of 2024, the annualized Gross Domestic Product (GDP) growth was slightly below expectations at 1.4%. Yet, in the second quarter, the GDP growth more than doubled, reaching an annualized rate of 3.0%, according to the latest estimates.
Figure 3: Yield Curve Inversion July 2022 (2Y/10Y Spread)

The Yield Curve Exits Inversion
In the July 2024 Federal Open Market Committee (FOMC) meeting, the Federal Reserve signalled its intention to lower the federal funds rate. Although the Fed maintained its current target range for the rate, it expressed a focus on “risks to both sides of its dual mandate,” hinting at a potential shift towards easing monetary policy. This shift was supported by inflation moving closer to the Fed’s 2% target and a slight weakening in the labor market, with the unemployment rate rising from 3.4% to 4.1%.
Short-term yields are closely connected to the federal funds rate. When news emerged that the Federal Reserve might lower this rate, the market quickly adjusted its expectations for future interest rates. As a result, short-term interest rates, such as those for 3-month and 2-year bonds, began to decline in anticipation of the expected rate cut.
The increased demand for short-term bonds further pushed their yields lower. In the bond market, prices and yields move in opposite directions—when bond prices rise due to higher demand, the yields (or interest rates) decrease. To secure higher yields before the anticipated rate cut, investors flocked to buy short-term bonds, causing their yields to fall. This surge in demand eventually led 2-year bond yields to drop below 10-year yields, bringing an end to the prolonged yield curve inversion.
Federal Reserve Action
In its September meeting, the Federal Open Market Committee (FOMC) decided to lower its benchmark overnight borrowing rate by 50 bps, bringing it to a range of 4.75% to 5.00%. Federal Reserve Chair Jerome Powell explained that this move was aimed at keeping the economy in its current “good shape” as inflation showed progress.
The FOMC’s dot plot, which reflects the year-end rate expectations of its 19 participants, suggests an additional 50 bps in cuts by year-end, with two meetings left on the calendar.
What Can Investors Look Forward To?
The yield curve emerging from an inversion can positively influence both the economy and investors. With the looming threat of economic trouble fading, market participants regain confidence, fostering a renewed willingness to take risks. This boost in confidence can lead to increased capital flows into equities and other higher-risk assets, potentially driving prices higher and fueling growth across the markets.
As short-term interest rates decline, borrowing becomes cheaper, making financing more accessible for both businesses and consumers. This encourages spending, investment, and boosts corporate profits, creating a favourable environment for stock markets as companies see improved earnings potential. Additionally, the easing of financial conditions makes credit more available, helping businesses expand or refinance debt at lower costs, spurring further growth.
In the bond market, falling short-term yields increase the value of existing bonds with higher fixed coupon rates, as they offer better returns than newly issued bonds. This rise in bond prices benefits investors holding these bonds. Additionally, a steepening curve can provide opportunities for gains in long-term bonds as investors become more willing to hold them amid improved economic expectations.
While the yield curve coming out of an inversion is generally seen as a positive sign for the economy, it is not without risks. If the Federal Reserve lowers rates too quickly or by too much, it could reignite inflation, leading to renewed upward pressure on long-term yields and forcing the central bank to reverse course. Additionally, a steepening yield curve does not guarantee that a recession will be avoided altogether. In some cases, economic slowdowns may still occur after the curve normalizes, as the effects of previous rate hikes work their way through the economy.
Moreover, the yield curve’s normalization might not necessarily signal a return to robust growth but could instead reflect lower inflation expectations and modest economic expansion. Investors should be cautious not to over interpret the curve’s steepening, as it doesn’t mean all risks have disappeared.
The yield curve is a vital economic and financial indicator, with its inversion and normalization offering both advantages and challenges. For investors, understanding the dynamics of the yield curve and its movements is essential, as it provides crucial insights into market conditions, potential risks, and opportunities in both fixed-income and equity markets.
DISCLAIMER
First Citizens Bank Limited (hereinafter “the Bank”) has prepared this report which is provided for informational purposes only and without any obligation, whether contractual or otherwise. The content of the report is subject to change without any prior notice. All opinions and estimates in the report constitute the author’s own judgment as at the date of the report. All information contained in the report that has been obtained or arrived at from sources which the Bank believes to be reliable in good faith but the Bank disclaims any warranty, express or implied, as to the accuracy, timeliness, completeness of the information given or the assessments made in the report and opinions expressed in the report may change without notice. The Bank disclaims any and all warranties, express or implied, including without limitation warranties of satisfactory quality and fitness for a particular purpose with respect to the information contained in the report. This report does not constitute nor is it intended as a solicitation, an offer, a recommendation to buy, hold, or sell any securities, products, service, investment or a recommendation to participate in any particular trading scheme discussed herein. The securities discussed in this report may not be suitable to all investors, therefore Investors wishing to purchase any of the securities mentioned should consult an investment adviser. The information in this report is not intended, in part or in whole, as financial advice. The information in this report shall not be used as part of any prospectus, offering memorandum or other disclosure ascribable to any issuer of securities. The use of the information in this report for the purpose of or with the effect of incorporating any such information into any disclosure intended for any investor or potential investor is not authorized.
DISCLOSURE
We, First Citizens Bank Limited hereby state that (1) the views expressed in this Research report reflect our personal view about any or all of the subject securities or issuers referred to in this Research report, (2) we are a beneficial owner of securities of the issuer (3) no part of our compensation was, is or will be directly or indirectly related to the specific recommendations or views expressed in this Research report (4) we have acted as underwriter in the distribution of securities referred to in this Research report in the three years immediately preceding and (5) we do have a direct or indirect financial or other interest in the subject securities or issuers referred to in this Research report.
